Scanning
In this section is explained the different steps to configure, start and supervise a security scanning over a web site.
Configuring the scan
To scan the web sites in different ways there are different plugins that can be configured in different ways.
In the second column of the main window you can select which plugins to configure. This plugins are separated in two big sections, as you can see in the following picture.
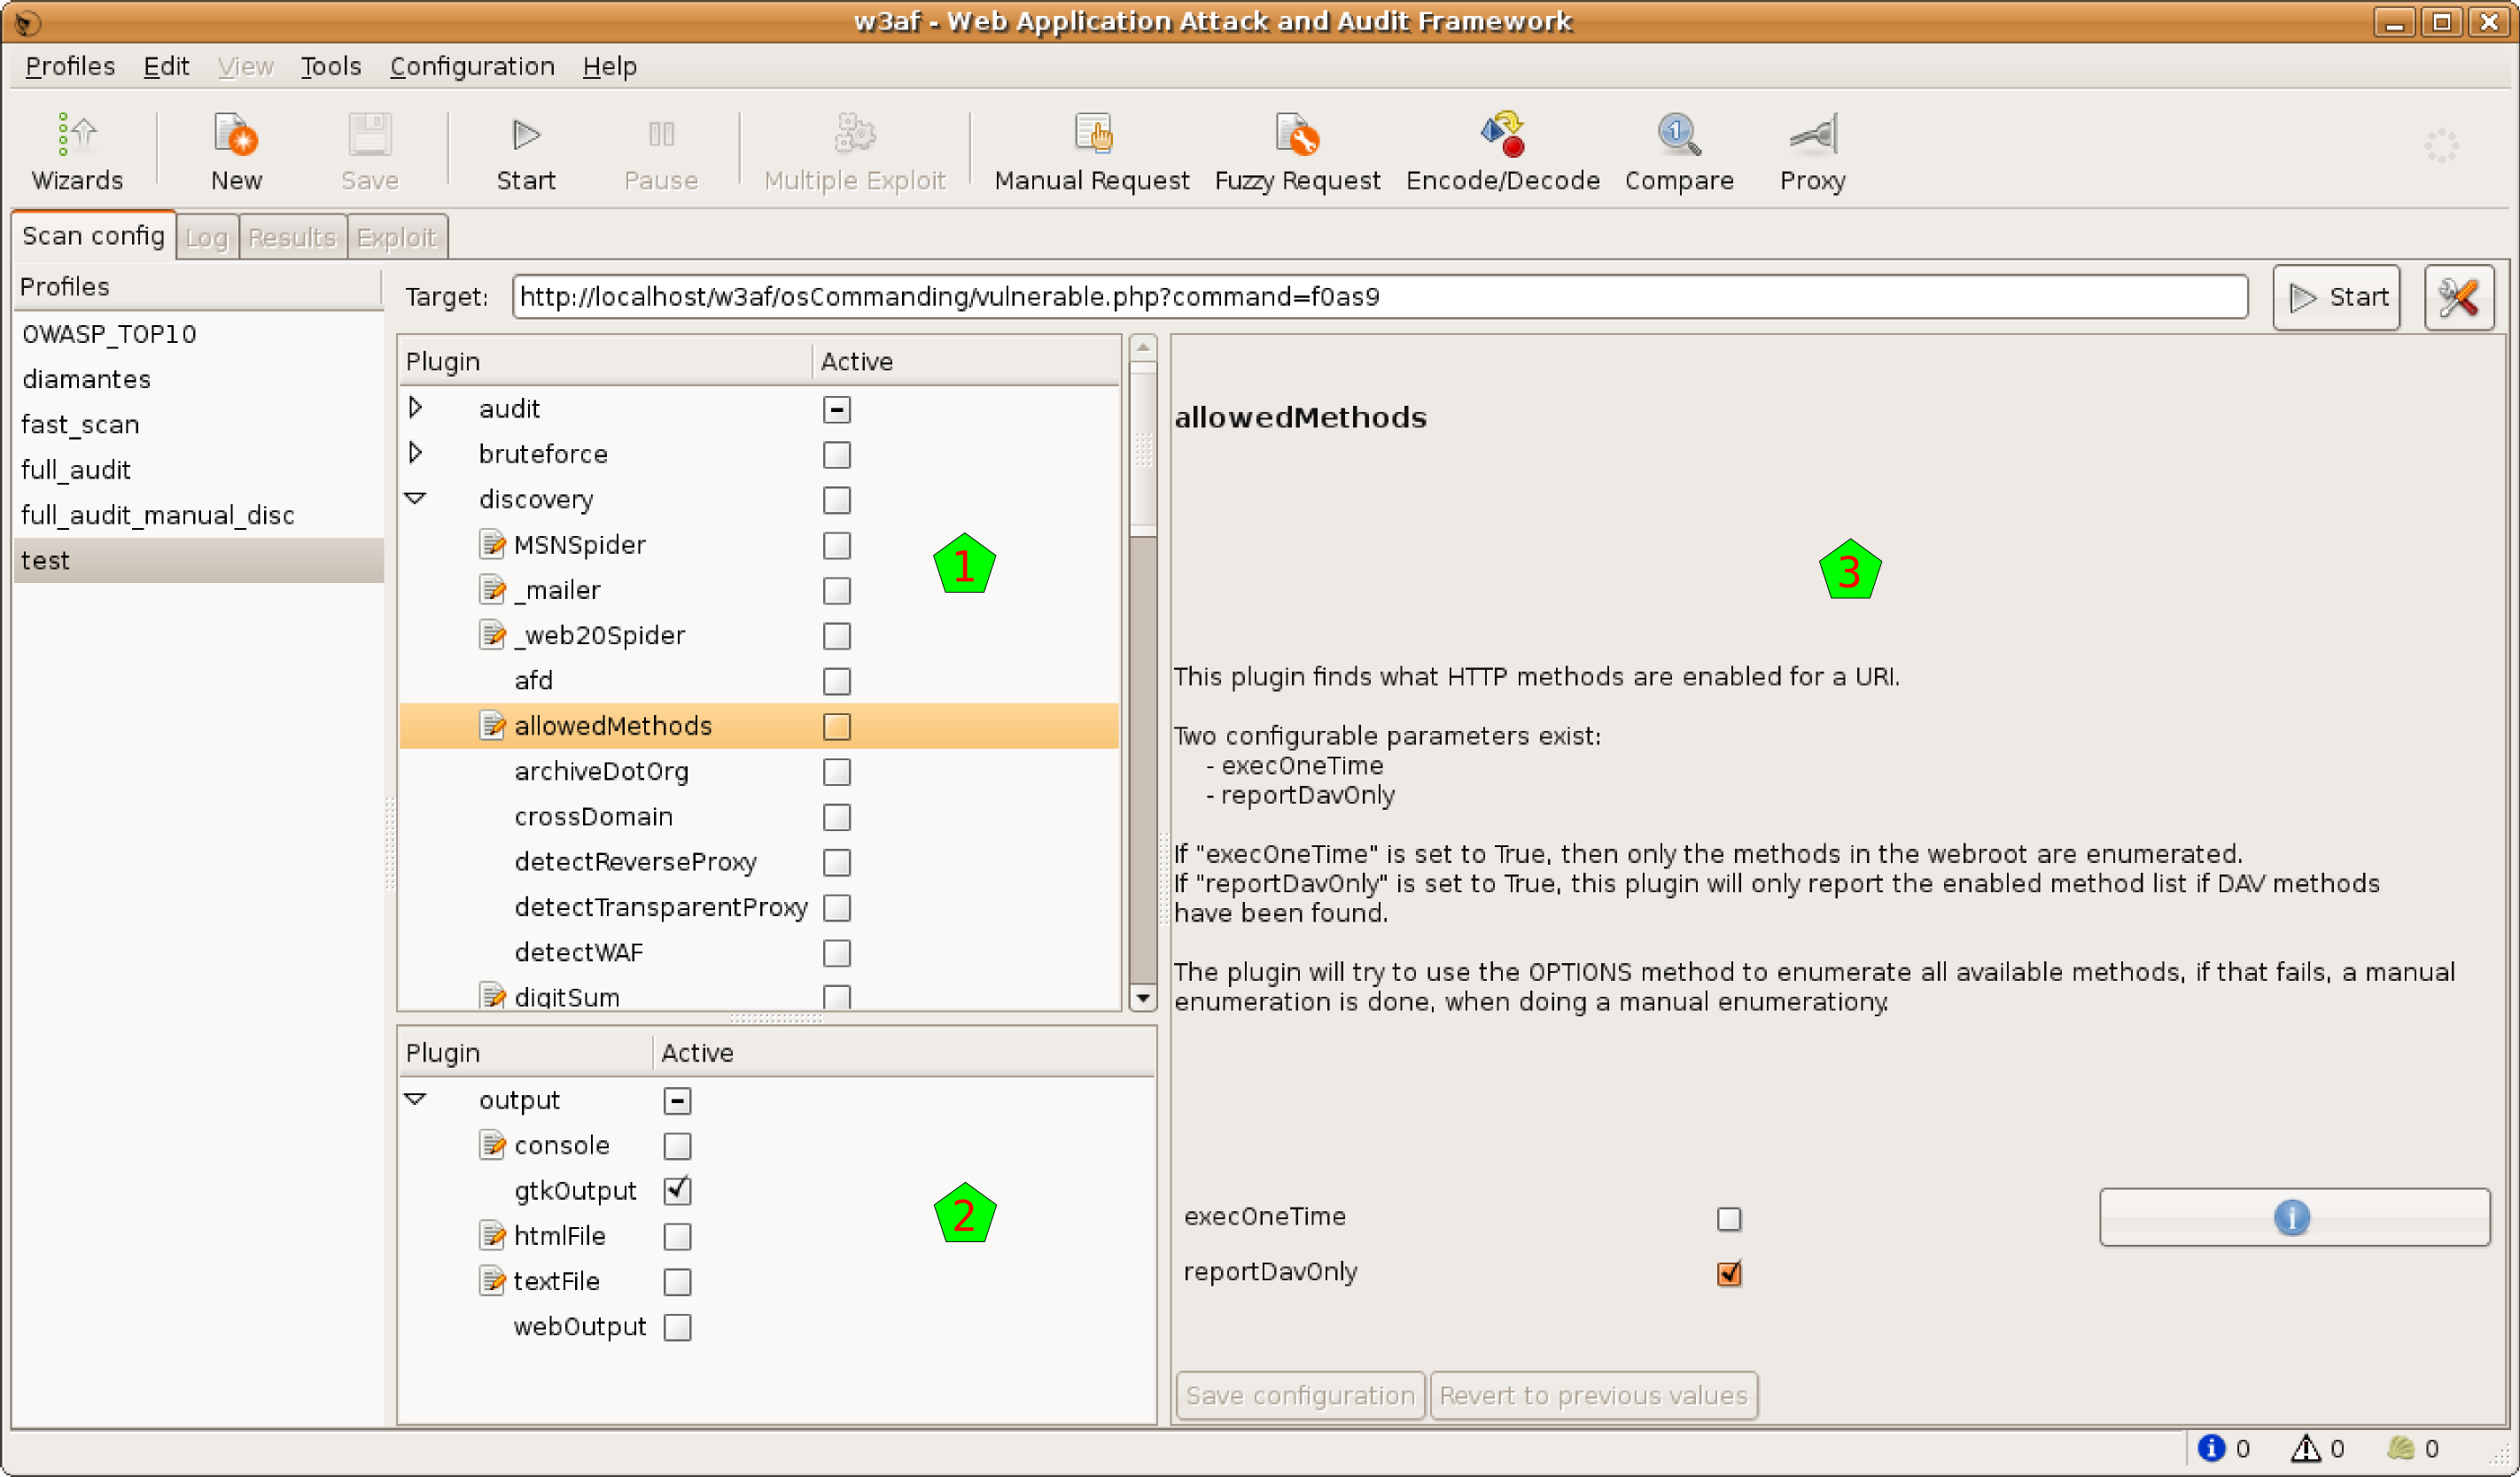
The first section has all the scan plugins, in the upper part of the column [1]. There you have the different plugins grouped regarding the scan type. They are separated in:
auditbruteforcecrawlinfrastructureevasiongrepmangleoutput
In the lower part of the column [2] there are the output plugins. Note that you can enable here the console plugin to see all the information in the standard output, and also have plugins to send all that information to a file in different formats.
If you select on any plugin you will see in the right pane [3] some information of that plugin. If that plugin is configurable (something that you can know in advance, because the plugin has an editable icon in the plugin trees [1] & [2].
To configure the plugin, just select it, and modify the options that appears on in the right pane [3]. Note that you need to Save the configuration to use it. You can see easily if any plugin is modified and not saved because its name will be in bold font.
Even if you configure a plugin, to actually use it during a scan, you need to check it. You have, at the right of each plugin, a check box that you need to select to use that plugin during the scan. If you click on the group check box, all the plugins in that group will be selected and deselected. If some plugins in that group are selected, and others are not, you’ll see the group’s check box in an intermediary state (as you can see in [2] for output).
If you make right-click over a plugin (or select Edit Plugin in the Edit menu), a text editor will open and you’ll be able to actually edit the plugin source code.
To finish configuration the scan, you need to insert a target URL in the upper text entry. When everything is ready to run, you will note that the Play buttons are automatically enabled.
Using the profiles
In the profiles you can save different configurations. You can think a Profile as the collection of configured plugins and target URL. In the column of the left [1] you can see which plugins do you have:
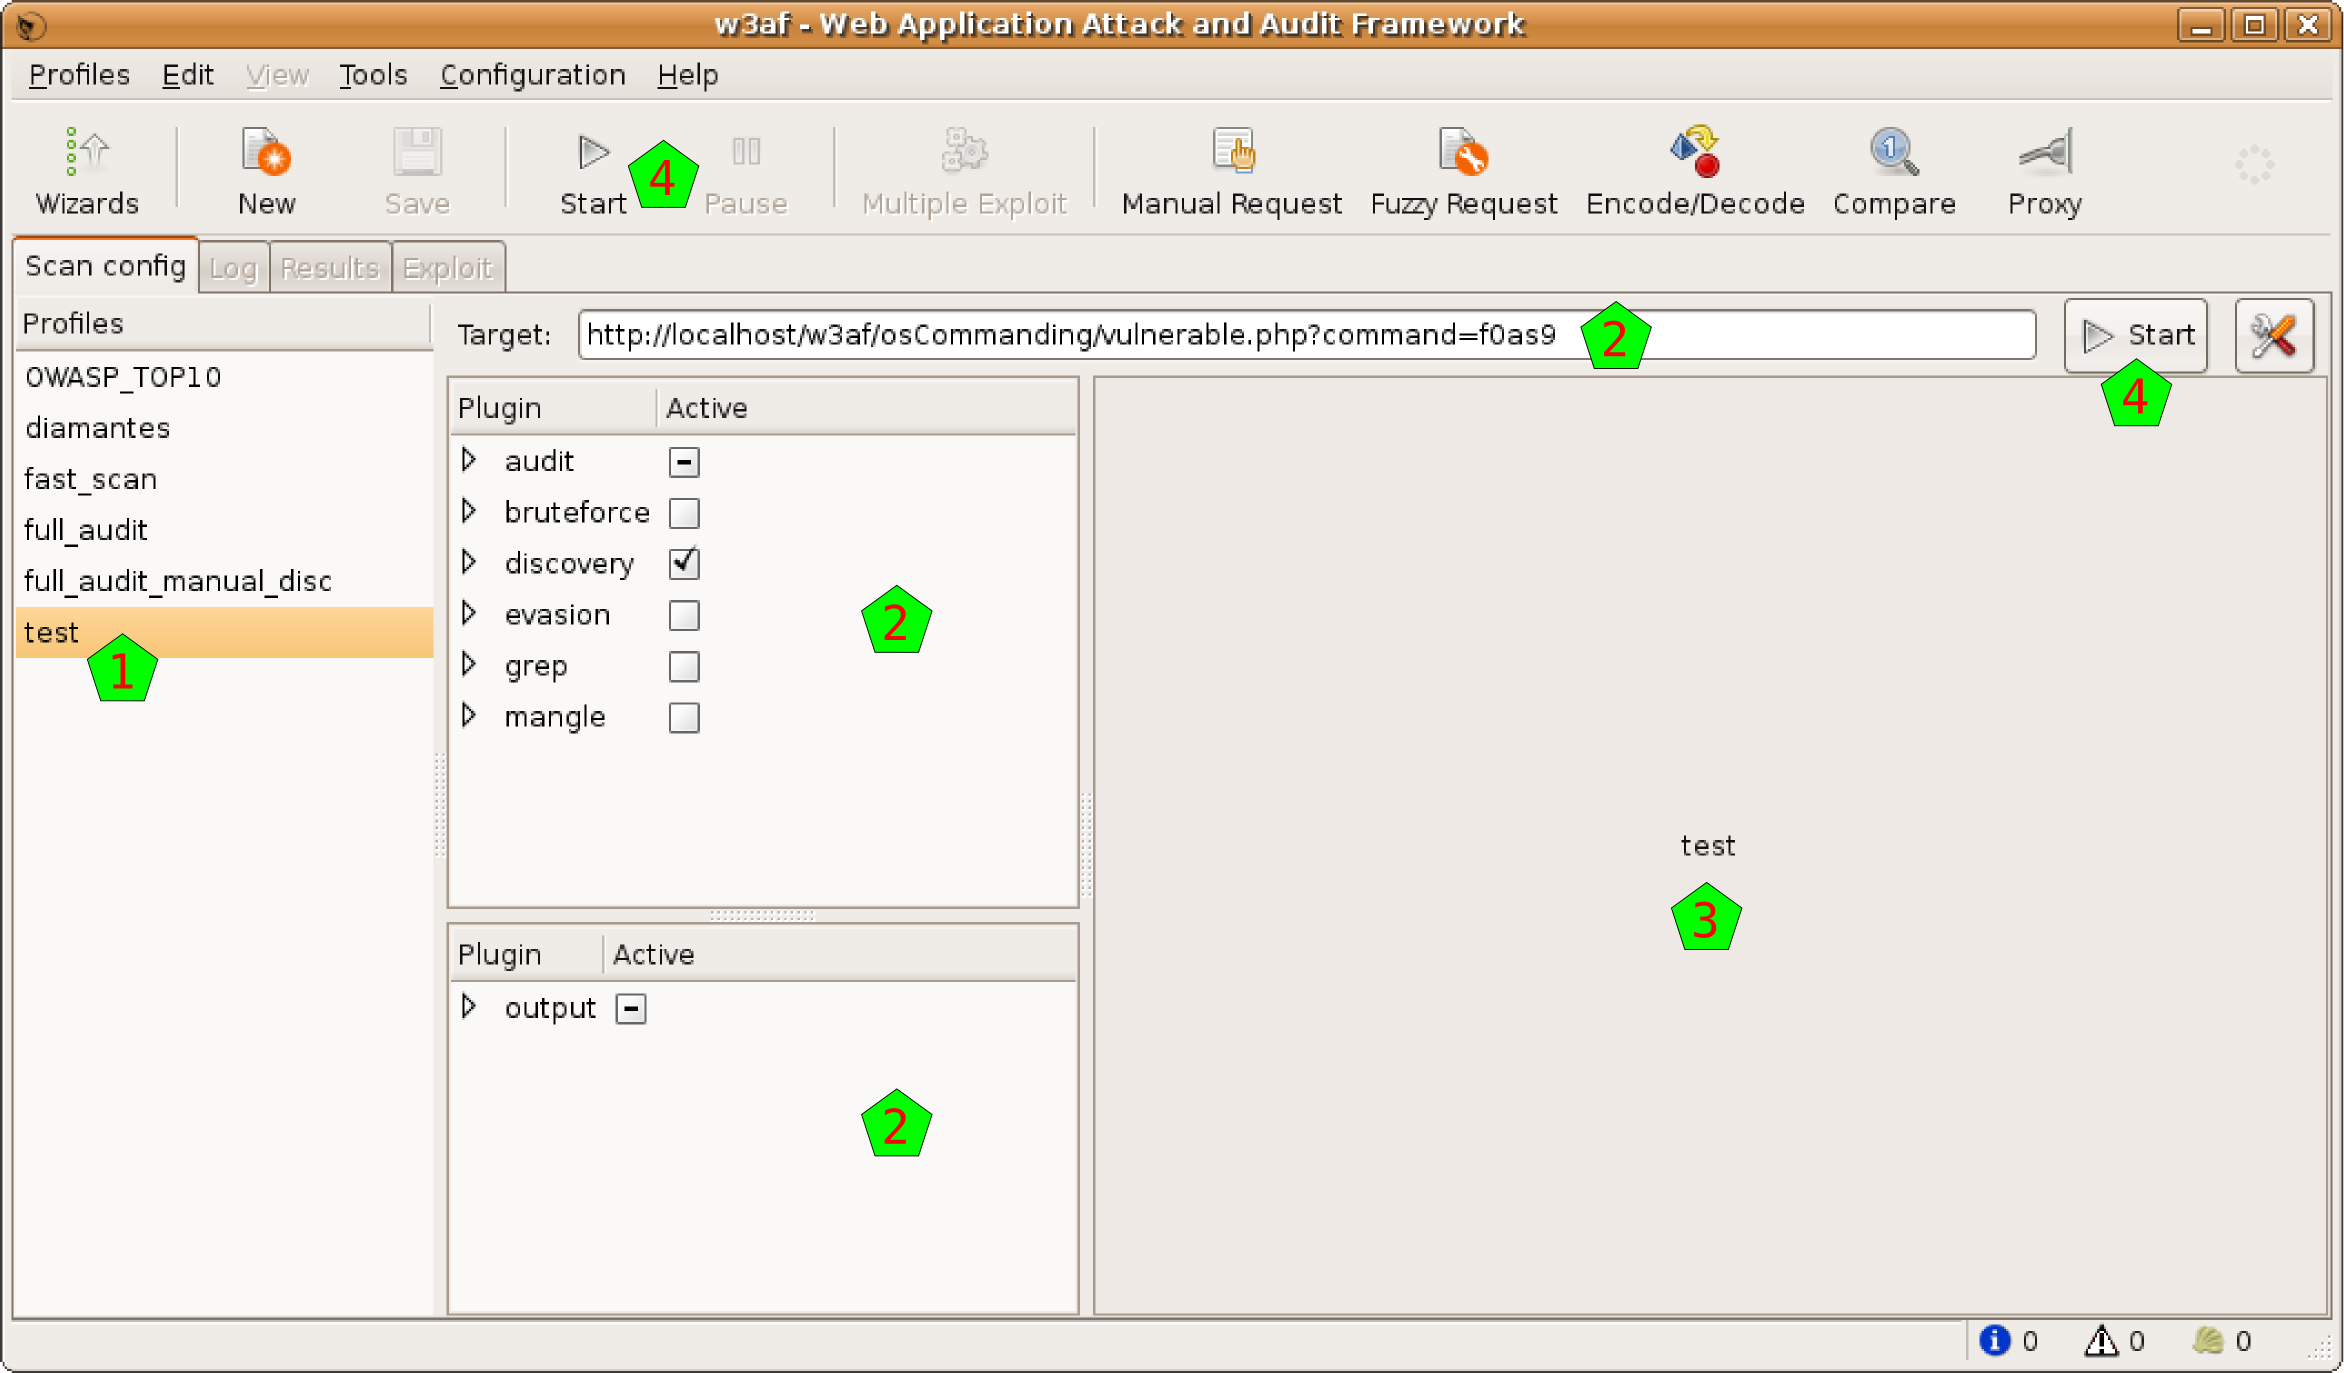
In this example, I selected a test plugin. In the moment I select it, the plugins and the target URL are all reconfigured [2]. Also, in the pane at the right, you can see a description of that plugin [3].
See, as now we have all the information needed to start the scan, that the Start buttons [4] are enabled. Note, however, that is possible that in the profile there was no saved URL, so the target URL will remain empty (you’ll find it with a “Insert the target URL here” message). In the Profiles menu,or doing right-click over any profile, you can see different actions that you can apply over the plugins:
- Save: Save the actual configuration to the profile. This will be enabled only if you changed some of the profile configuration.
- Save as: Save configuration a new profile, without affecting the one selected so far. If you click on this option, you will need to enter a new profile name and description.
- Revert: Discard the actual configuration and reload the one that is saved in the profile.
- Delete: Delete this profile
To create a new profile, you have the New button in the toolbar, and also the New option in the Profiles menu. To create a new profile, you will need to enter a name and descriptions. After creating the new profile, you’ll be able to configure to your needs. Remember that you can always create a new profile using the Point and Click Penetration test tool, with the Wizard button at the toolbar’s left.
Running the scan
To actually run the scan some conditions need to be met: at least one plugin needs to be activated, and a target URL must be set. You’ll notice that everything is OK to go, because the Start button will be enabled.
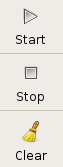
The whole scan process is controlled with two buttons that you can find in the toolbar. The first button is the Start one. When you click on it, the scan will start running, and you will see the throbber spinning. After the process starts, it can be stopped anytime, or you can let it go until the end, and it will finish automatically. To stop the process you can use the same button, note that it mutated and now it is called Stop: if you click on it you will see that it gets disabled, and there’s some delay until the process is effectively stopped, you can check it because the throbber stopped spinning. When the scan is stopped, you can study the results all that you want, but if you want to start another scan you will need to clear the current results and start over. For this, you’ll use again the same button as before, but note that it is called Clear now.
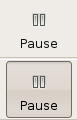
The second button to control the process is the Pause one. It will be enabled only when the process is running, and if you click on it, it will be pressed down (and the process paused) until you click on it again. Note that if you pause the process you can not cancel it until you restart it.
When the scanning process is started, the system will switch automatically to the Log tab. In this tab you can see how the scan evolves through the different indicators.
This tab has two main sections. In the upper part you have the logging text, where you can see all the information generated by the system. In the principal section of that part [1] you can see all the messages generated by the system, from the first one to the last generated. As this log is normally a large quantity of text, you can enable and disable the different type of messages, using the checkboxes in the log bar [4]. Note that these different types have different colors in the text itself. In the same bar you have a Search button, which enables the search functionality (explained in detail below).
Also, below that messages you can see exactly what the system is currently doing, through a single line message [2].
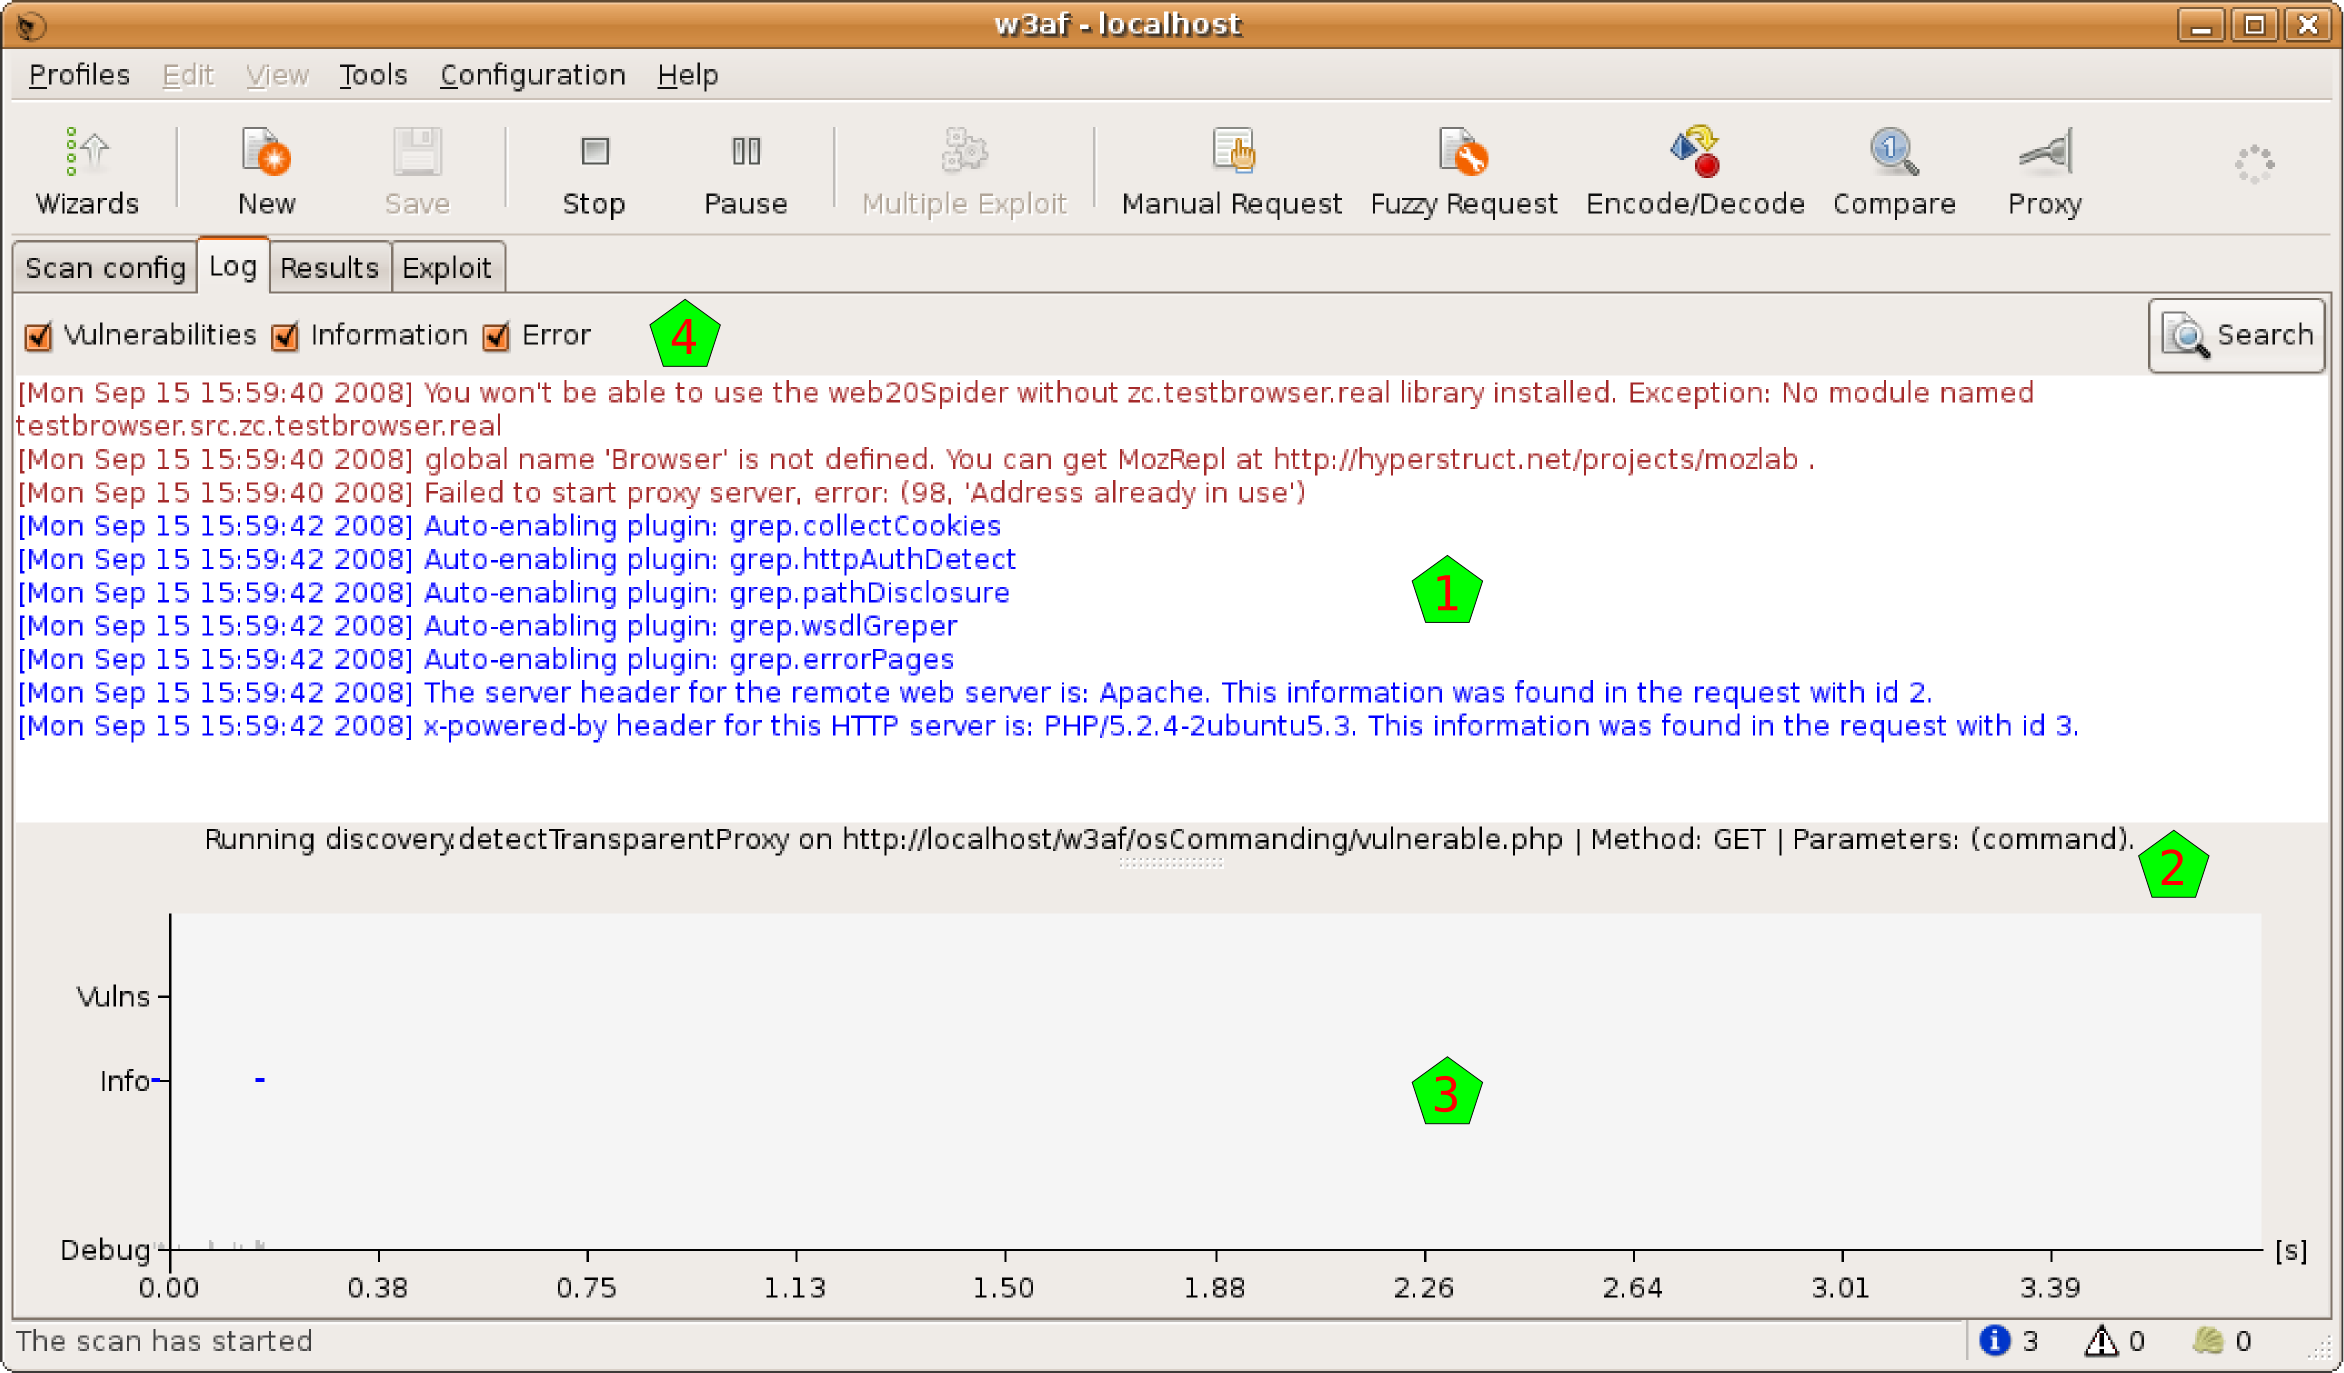
In the lower part of the window you can see a graph that represents what is going on with the scanning process in a visual way. In the x axis you can see the time (automatically rescaled), and in the y axis you can find three indicators: a grey bar which height indicates the quantity of debug messages at that time, a blue dot if there’re information messages, and a vertical red bar with the quantity of vulnerabilities found there.
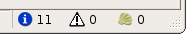
All this information is updated in real time. For a better visual following of the process, you also have, at the right of the toolbar, three indicators showing the quantity of information items found, of vulnerabilities found, and the shell which were successfully exploited (you’ll find more information about this Shells in the Exploit section of this document).
Sometimes the log information is too much, even if you can separate it in the different message types, so there’s a search functionality to help you. You can open the search bar using the previously mentioned button, or pressing CTRL-F when the log text window is in focus.
When the search bar opens, you’ll see a text entry where you can write what you want to find, a Next and Previous buttons, and a Match case checkbox:
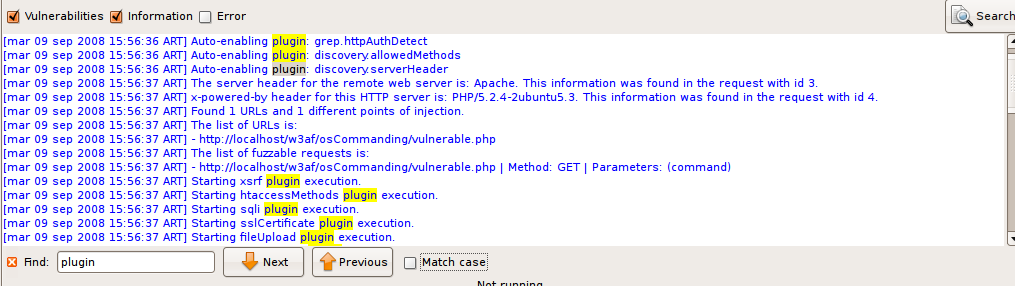
The system will find what you write in the text entry in real time, taking the letter case in consideration if the Match case checkbox is selected. If the inserted text doesn’t match with anything in the whole text, the entry background will turn red.
Also in real time the matching text will be highlighted in yellow. If you hit the Next or Previous buttons, the system will walk the matching texts.